UPDATED 9/14/23
Liberal media are declaring Bidenomics a success - but, hard numbers tell a much different story – regardless of whether the measure is how much Americans are paying, earning or saving.
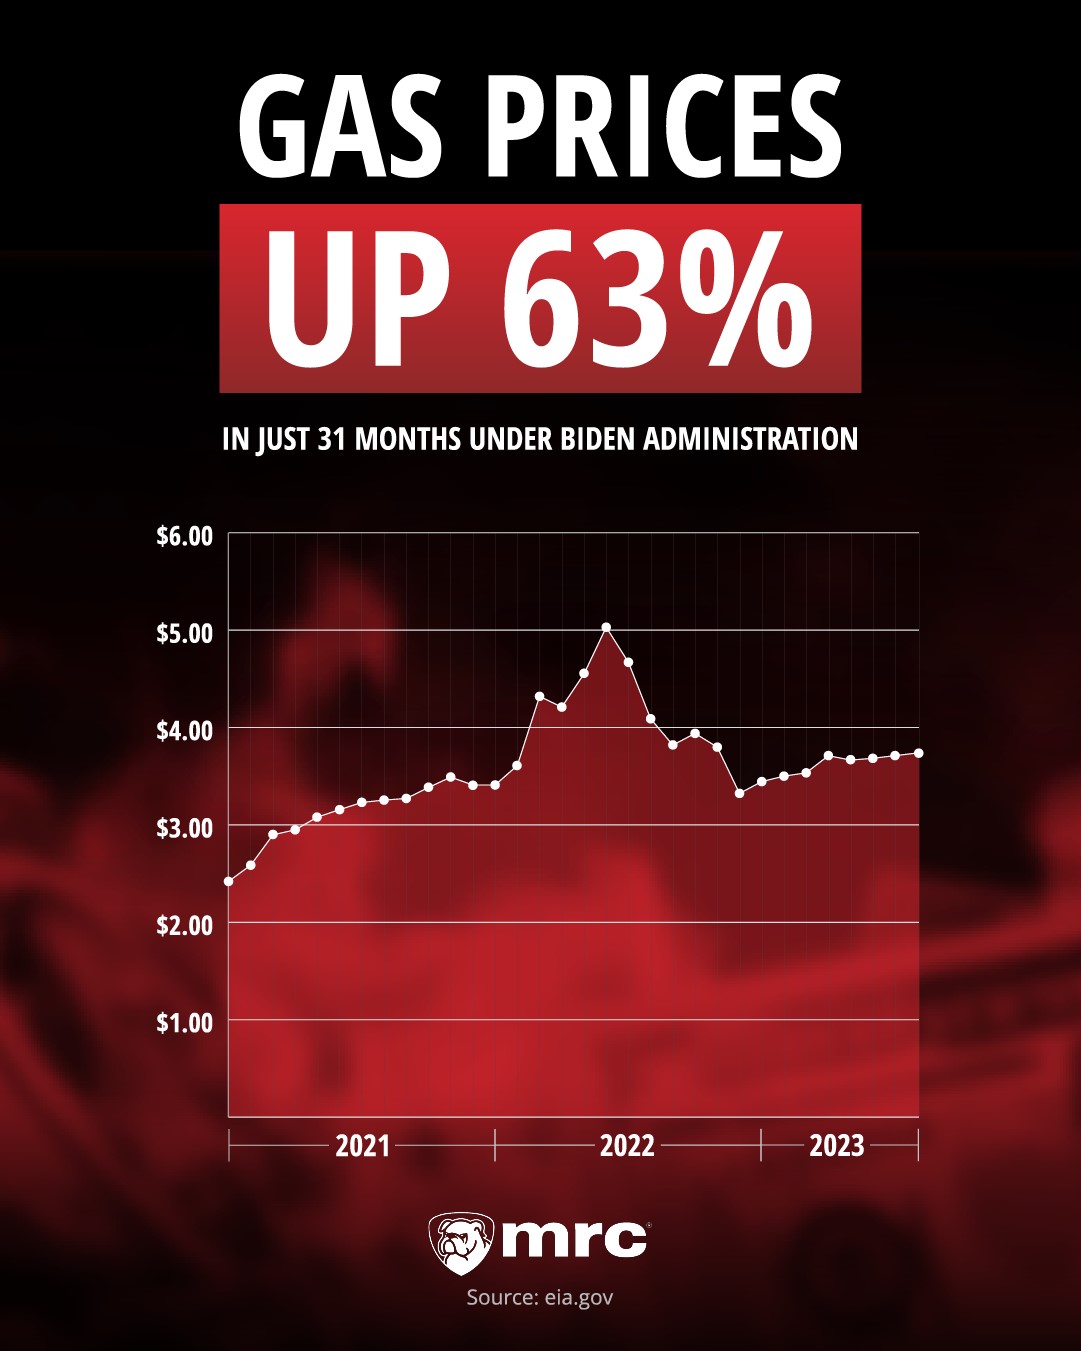
Gas prices:
While gas prices held steady under Pres. Donald Trump (down four cents a gallon), they’ve surged 63% in the first 31 months of Pres. Joe Biden’s term. From January 2021 to August of this year, the average price of a gallon of gas (all grades) has increased from $2.42 to $3.95, according to the U.S. Energy Information Administration.
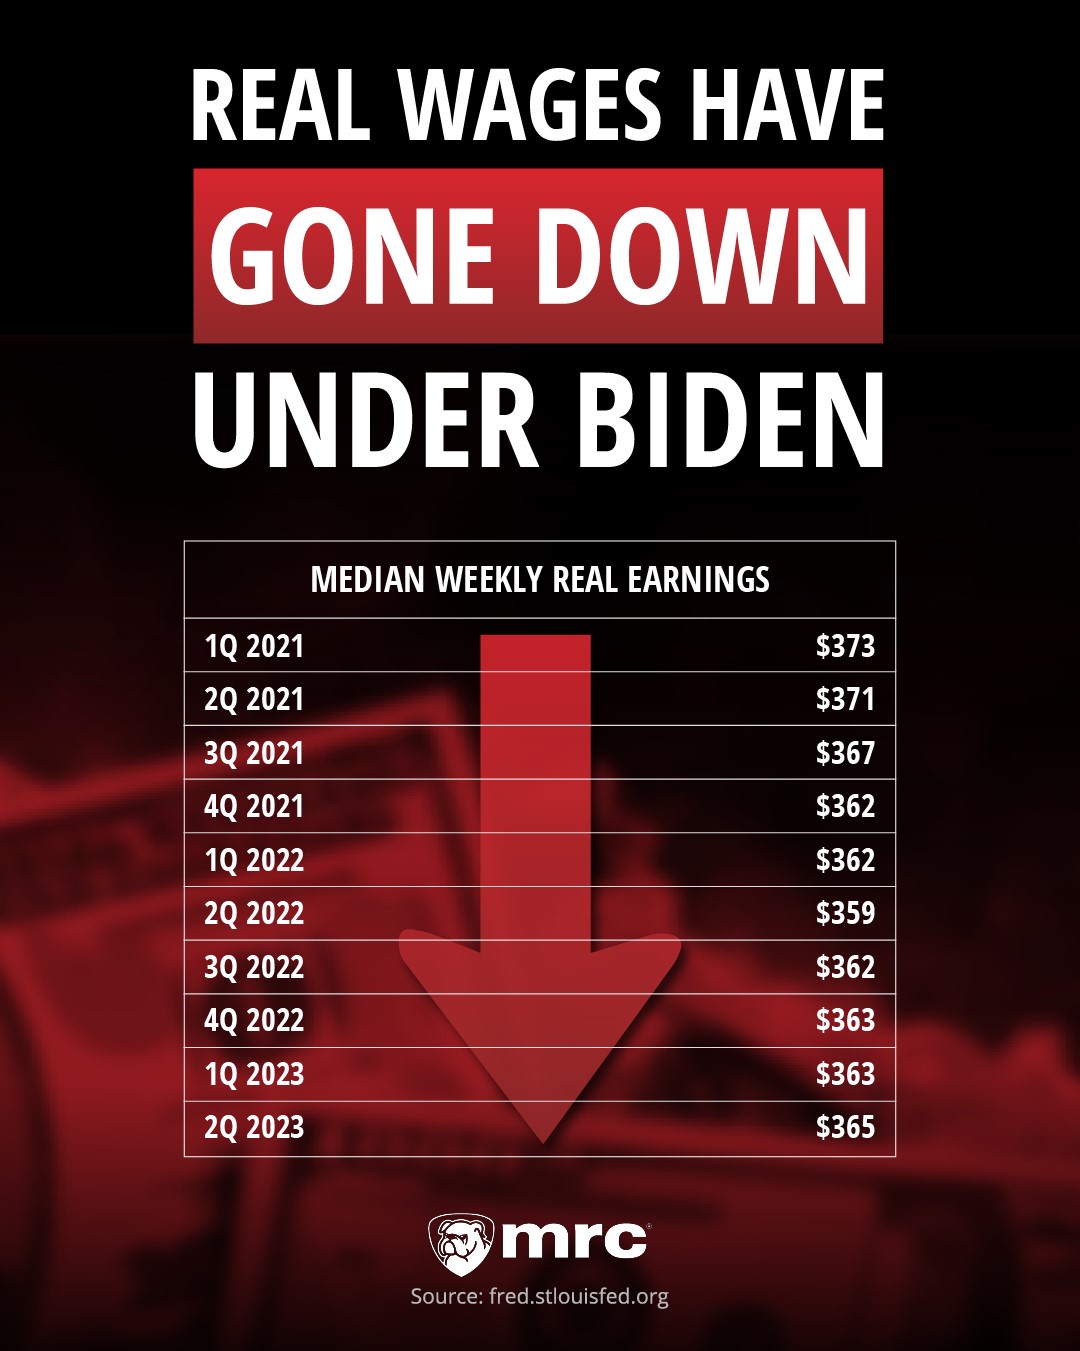
Real Wages:
After accounting for inflation, real wages earned by Americans have declined under Biden. In the first quarter of 2021, median weekly real earnings averaged $373. But, by the second quarter of this year, average real earnings had fallen to $365.
Under Trump, however, real wages rose from $352 on January 1, 2017, to $373 on January 1. 2021.
Real wages are calculated using Bureau of Labor Statistics (BLS) median usual weekly earnings for full-time employees at least 16 years old and are represented in terms of quarterly 1982-84 Consumer Price Index (CPI) seasonally-adjusted dollars.
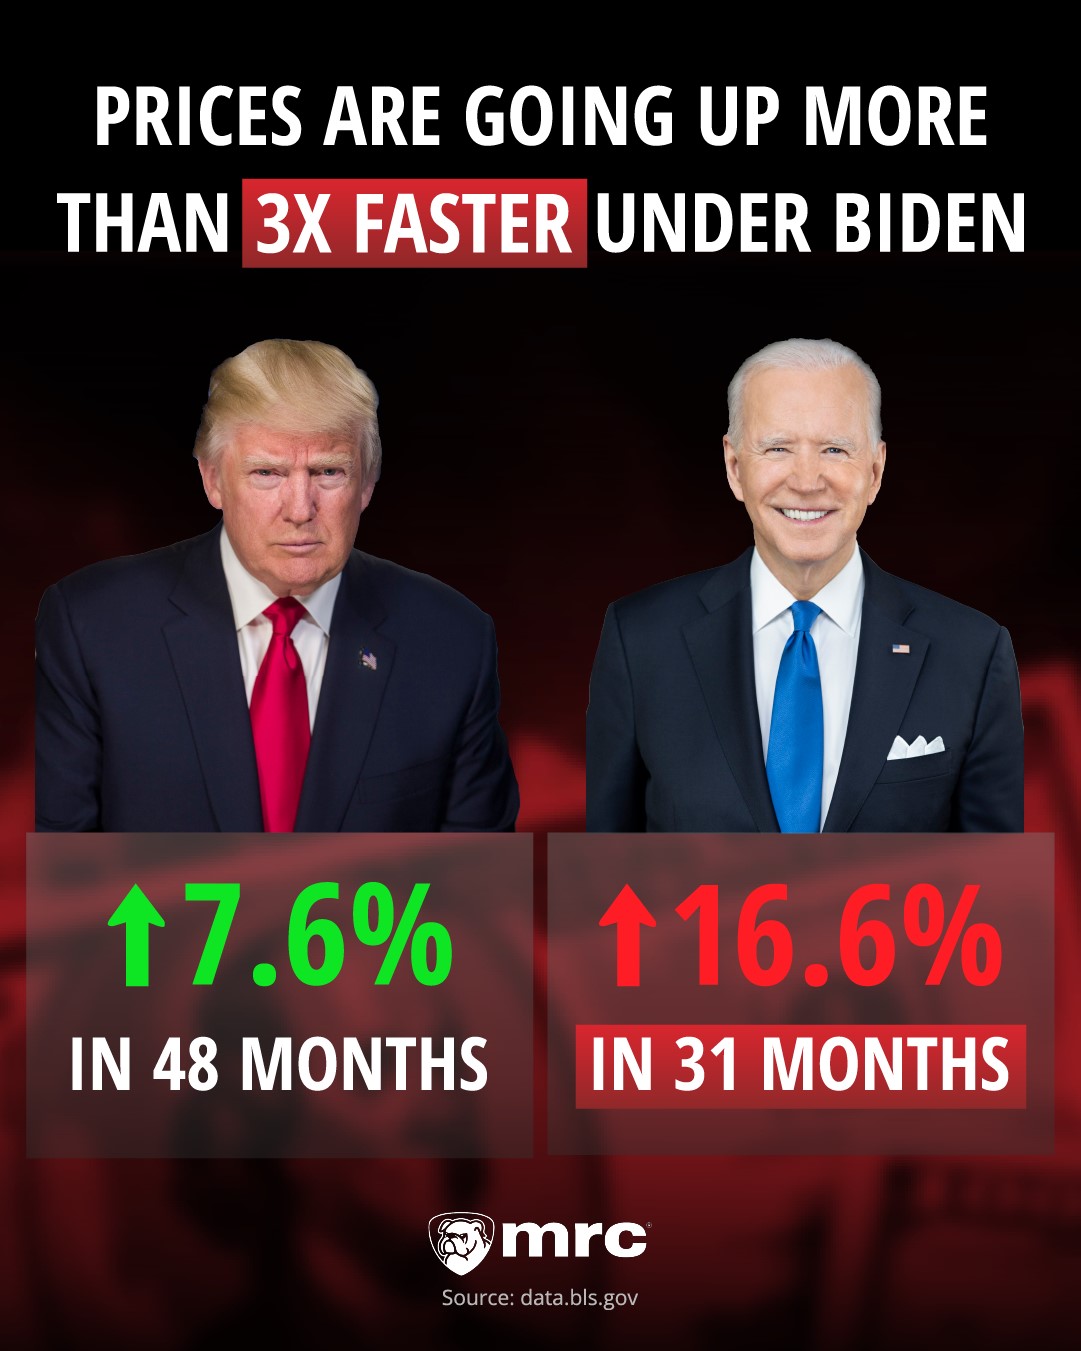
Consumer Price Index:
Consumer prices rose 7.6% in the 48 months of the Trump Administration, from a CPI of 243.618 in January 2021 to one of 262.035 in December 2020.
In contrast, prices have already risen more than twice as much, 16.6%, in just 31 months under Biden. Less than two-thirds of the way through his term, the CPI has risen from 262.650 in January of 2021 to 306.269 last month (August 2023), putting it on pace to increase more than three times as much as it did during Trump's full, four-year term.
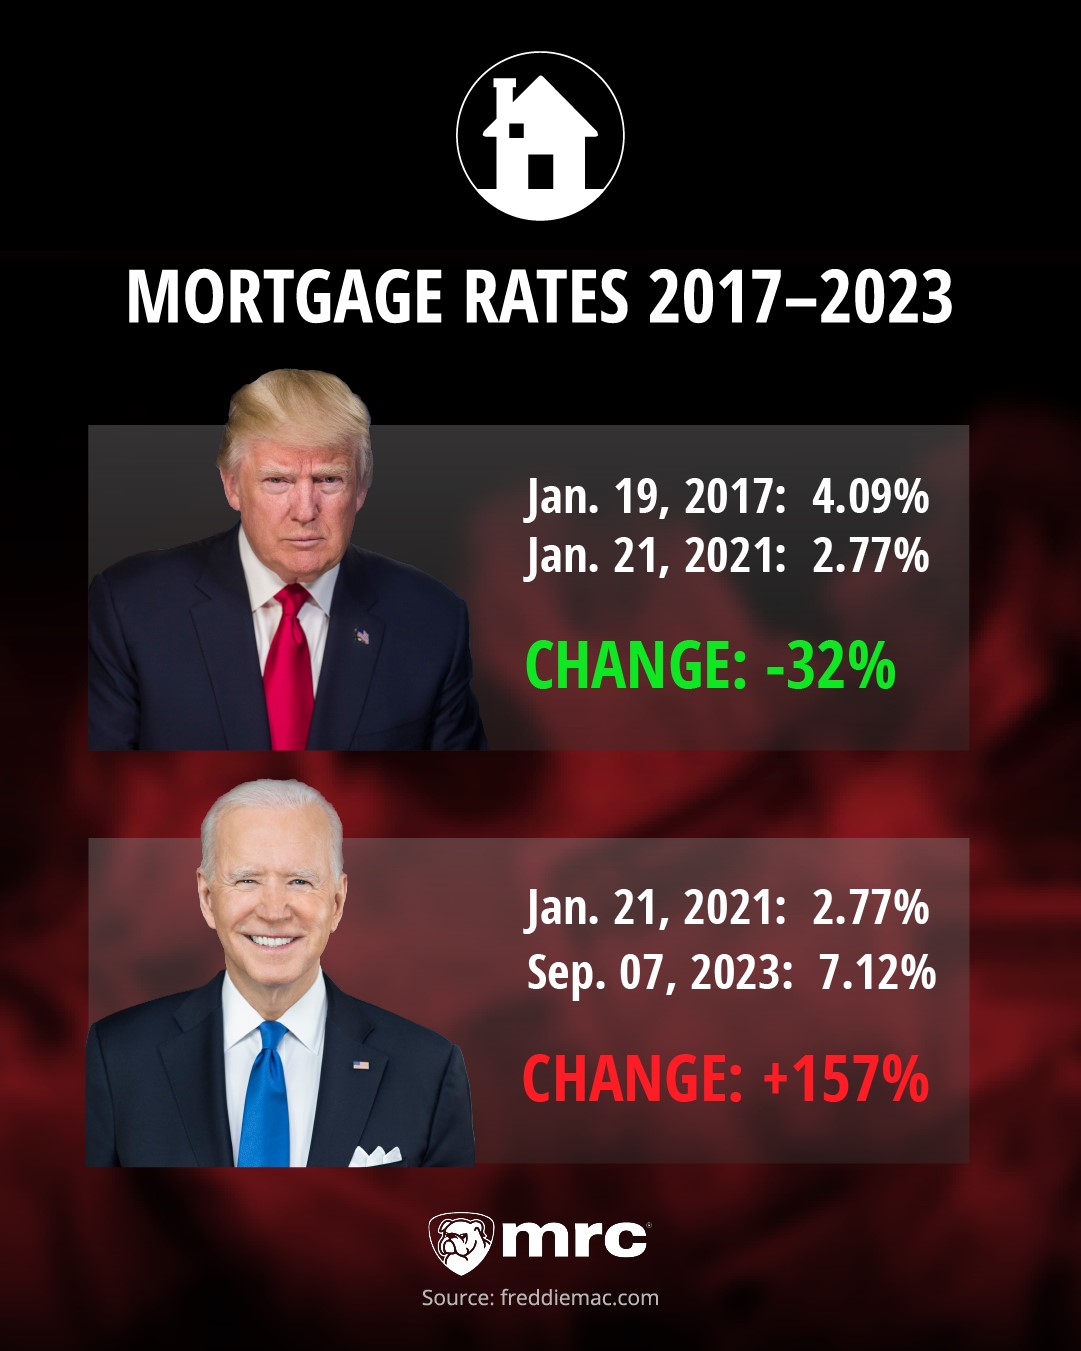
Mortgage Rates:
It’s also costing far more to finance a home purchase, under the Biden Administration.
Mortgage rates today are more than twice the average rate home buyers paid when Trump left office, Freddie Mac data reveal. Under Biden’s predecessor, the average 30-year fixed mortgage rate fell by a third, from 4.09% to 2.77%. But, by September 7, 2023, mortgage rates had more than doubled, increasing by more than four percentage points, to 7.12%.
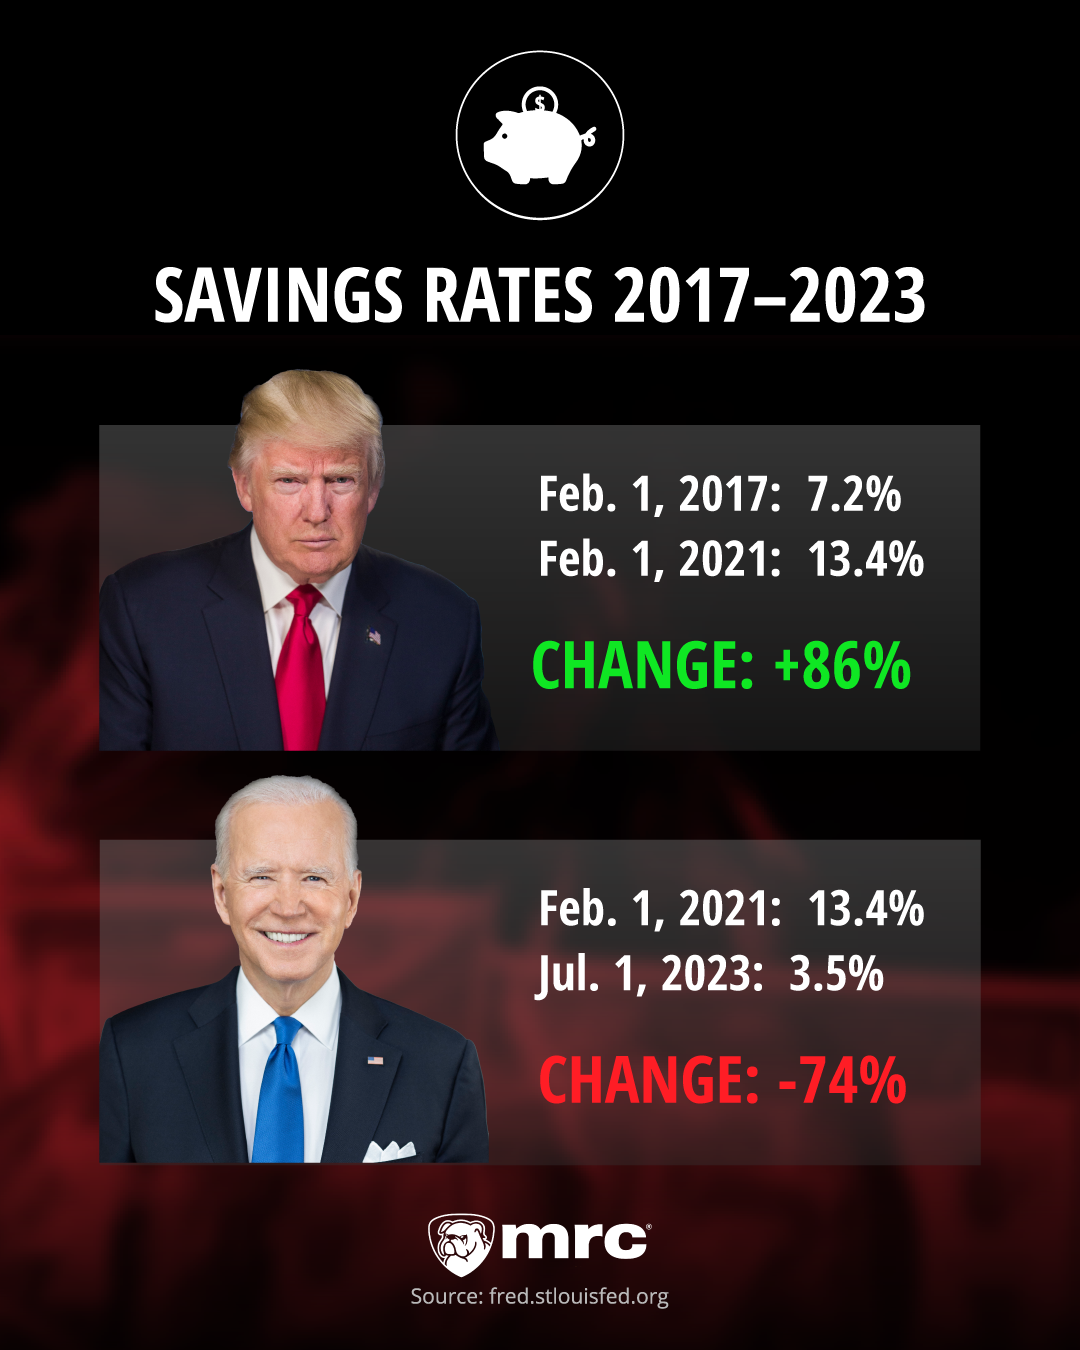
Savings Rates:
With Americans earning less and spending more, their average savings rate has declined under Biden.
From February 1, 2017 to February 1, 2021, the average personal savings rate increased 86%, from 7.2% to 13.4%. But, by July1 of this year, it had plummeted to 3.5% - a mere quarter of its pre-Biden level – according to Federal Reserve Bank of St. Louis (FRED) calculations, incorporating BLS data.
The business and economic reporting of CNSNews is funded in part with a gift made in memory of Dr. Keith C. Wold.